 The United States International Trade Commission (USITC) just released its updated “The Year in Trade 2017” report. This report covers all of the global trade trends from 2017. Included in this report are exchange rate trends, trade laws and regulations, global economic trends, regional trade activity, global trade agreements, and new trade relations, among other topics. Let’s take a look at some of the most intriguing and important trade trends that occurred in 2017.
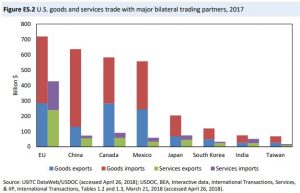
Trade Activities With Major Trading Partners
As expected, China was again named the United States largest single-country trading partner based on two-way merchandise trade in 2017. Merchandise trade with China accounts for 16.4 percent of total U.S. trades and amounts to $635.9 billion in trade. Behind China is Canada for the third consecutive year. U.S. and Canada trade rose 7 percent from the previous year and amounted to $582.4 billion in 2017. Following China and Canada is Mexico with a value of $557 billion in 2017 trade. The figure below includes the top 7 single-countries the U.S. trades with, and also the E.U. which includes all countries the U.S. trades with in Europe.
U.S. Exports and Imports
In 2017, transportation equipment was the largest U.S. export sector accounting for 21 percent of all exports. Close behind was electronics (17.3 percent), and chemical related products (14.7 percent). The top individual export product were civilian aircraft, engines, and parts, along with refined petroleum products. The biggest U.S. import in 2017 was electronic products, which totaled for 20.7 percent of U.S. imports. On an individual basis, passenger motor vehicles were the largest U.S. import valued at $186.4 billion. China was once again the leading source of U.S. imports in 2017.
Exchange Rate Trends
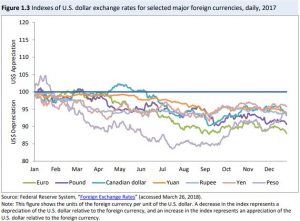
Overall, the U.S. dollar depreciated in 2017, falling 6.3 percent on the broad dollar index. This downward trend was mainly driven by the depreciation of the U.S. dollar compared to other major world currencies. The U.S. dollar fell by 12 percent against the euro, 9.4 percent against the pound (UK), 6.8 percent against the Canadian dollar, and 6.1 percent against the Mexican peso. Several major U.S. investment banks noted that the euro and pound were recovering from an early drop due to the uncertainty of the Brexit vote. The figure below shows the U.S. dollar exchange rate compared to other major world currencies.
U.S. GDP in 2017
The United States had a $19.4 trillion economy in 2017, and the economy grew faster in 2017 than it did in 2016. U.S. real gross domestic product (GDP) increased 2.3 percent in 2017 compared to the growth rate of 1.5 percent in 2016. The main factors driving this high growth rate were due to four industries- professional and business services; finance, insurance, real estate, rental, and leasing; manufacturing; and retail trade.
To read the full report, The Year in Trade 2017, published by the United States International Trade Commission, click here.
If your company has import or export needs, you should consider working with Logistics Plus. In the U.S. we have more than a dozen locations that can help you with your transportation and logistics needs; and our Customs Broker Solutions staff can also help you clear customs for imports at any port in the United States. Additionally, Logistics Plus now has locations at 50 offices in 22 countries. As always, you can find any of our worldwide employees in our online global directory.