
by logisticsplus | Apr 19, 2017 | News
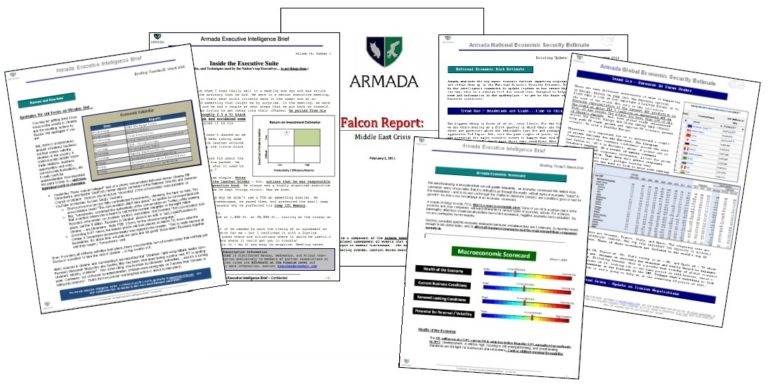
If you’re looking for reliable, insightful, and digestible economic, political, and business intelligence, you should check out Armada Executive Intelligence. Their Black Owl Report executive briefing system is a must-have for any business leader wanting to stay current on global news and events that could impact your supply chain. Shown below is an excerpt from the Wednesday 19, April 2017 Black Owl Report briefing with news and comments regarding the latest IMF (International Monetary Fund) World Outlook Update. The IMF projects the world economy to grow at a pace of 3.5 percent in 2017, up from 3.1 percent last year, and 3.6 percent in 2018. Acceleration will be broad based across advanced, emerging, and low-income economies, building on gains it has seen in both manufacturing and trade.
Here is the Armada Black Owl Report excerpt:
*****************************************************
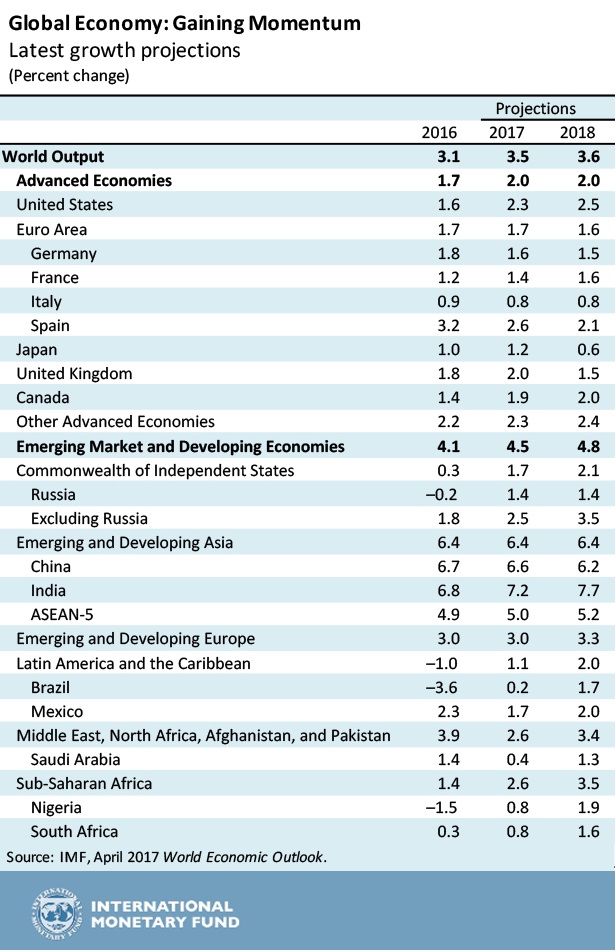 World Growth to Accelerate According to IMF. The IMF has released its latest World Outlook update, and it bumped up global growth from 3.4% to 3.5%. It left most of its 2018 outlook unchanged – primarily because of Brexit and a few unknowns that could affect global growth. To pull a few highlights out of the report, here are the items that caught our eye:
- From a geopolitical perspective, it would seem that Russia has less to worry about (economically speaking). The IMF sees the country growing finally at 1.4% in 2017 and 2018. That changes the negotiating perspective between Russia and the rest of the world. If it can grow despite economic sanctions imposed on it, then it has flexibility and the ability to maneuver. The global community could always ratchet up global sanctions, but it would take a lot more to get the world to move. Otherwise, unilateral action is likely to have less impact in the future (and therefore becomes a lesser deterrent).
- Emerging markets in general will see growth of 4.5% this year, compared to 4.1% last year.
- China outlook has improved slightly, but the IMF still believes that it will see growth behind its 2016 performance.
- India will see growth accelerate further, growing at 7.2% in 2016 vs. 6.8% in 2016. India ranks 7th among the largest economies in the world, but had just $2.2 trillion in output in 2016 (compared to China’s $11 trillion or the US’ $18 trillion).
- Growth in most of Europe was also lifted by .1 percentage point in 2017, but remained unchanged in 2018. The uncertainty of Brexit (as mentioned) is the greatest factor limiting the IMF from hiking growth expectations in 2018.
- Closer to home, Canada growth was left unchanged at 1.9% for 2017, which is still improved from the 1.4% growth rate experienced in 2016. Mexican growth was also left unchanged at 1.7%, down from the 2.3% posted last year. Uncertainty over NAFTA negotiations, weaker oil prices, and an unexpected sluggishness in global automotive demand has weakened the outlook.
- Lastly, the IMF is baking in some rough geopolitical conditions into several regions (you can read the full, online report here).
*****************************************************
If you’re interested in checking out the Armada executive briefing reports for yourself, they’re currently offering a 30-day risk-free trial. The Black Owl Report is published twice weekly, with other valuable reports periodically interspersed. Click the image below for more details.
Need help managing your global supply chain? Logistics Plus has that part covered. Contact us for more information.

by logisticsplus | Apr 13, 2017 | News
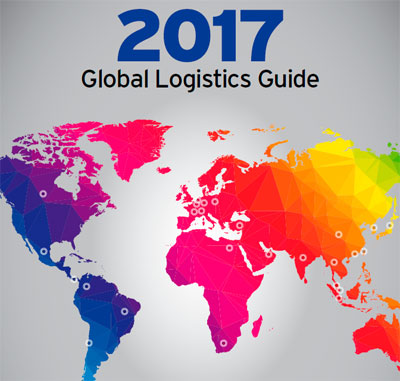
The folks at Inbound Logistics magazine published their 13th annual Global Logistics Guide in the March 2017 issue. You can also read the full report online. As part of the report, Inbound Logistics ranks major foreign countries according to the following criteria:
- Transportation infrastructure (T)
- IT competency (I);
- Business culture (B); and
- Intangibles (X).
For your benefit, we have summarized the Inbound Logistics rankings below (10 is the highest score and 3 is the lowest):
| Region |
Country |
Overall |
T |
I |
B |
X |
| Europe |
Netherlands |
10 |
4 |
3 |
3 |
0 |
| Europe |
Germany |
9 |
4 |
3 |
2 |
0 |
| ME/Africa |
UAE |
9 |
4 |
2 |
2 |
1 |
| SE Asia/India |
Singapore |
9 |
4 |
3 |
2 |
0 |
| Europe |
Switzerland |
8 |
3 |
3 |
2 |
0 |
| Asia |
Hong Kong |
8 |
3 |
3 |
2 |
0 |
| Asia |
Japan |
8 |
3 |
3 |
2 |
0 |
| Americas |
Canada |
7 |
2 |
3 |
3 |
-1 |
| Americas |
Panama |
7 |
3 |
1 |
2 |
1 |
| Europe |
France |
7 |
3 |
2 |
2 |
0 |
| Europe |
Belgium |
7 |
3 |
2 |
2 |
0 |
| SE Asia/India |
Malaysia |
7 |
3 |
2 |
2 |
0 |
| SE Asia/India |
India |
7 |
2 |
1 |
2 |
2 |
| SE Asia/India |
Taiwan |
7 |
3 |
3 |
2 |
-1 |
| Asia |
South Korea |
7 |
3 |
3 |
2 |
-1 |
| Americas |
Chile |
6 |
2 |
2 |
2 |
0 |
| Europe |
Poland |
6 |
2 |
1 |
2 |
1 |
| Asia |
China |
6 |
3 |
1 |
2 |
0 |
| Americas |
Colombia |
5 |
2 |
1 |
2 |
0 |
| Americas |
Mexico |
4 |
2 |
1 |
2 |
-1 |
| Europe |
Russia |
4 |
2 |
1 |
1 |
0 |
| SE Asia/India |
Indonesia |
4 |
2 |
1 |
1 |
0 |
| SE Asia/India |
Thailand |
4 |
2 |
1 |
1 |
0 |
| Asia |
Vietnam |
4 |
2 |
1 |
1 |
0 |
| Americas |
Brazil |
3 |
2 |
1 |
1 |
-1 |
| Europe |
Turkey |
3 |
2 |
1 |
1 |
-1 |
| ME/Africa |
South Africa |
3 |
2 |
1 |
1 |
-1 |
The good news is that if you are exporting to, or importing from, any of these countries, Logistics Plus has local offices or reliable agents in almost every one of these countries. So we can help you with affordable import/export transportation rates and customs clearance fees; we can help you with warehousing and distribution solutions if they’re needed; and we can help you address virtually any global trade compliance issue that might apply. If you do business in any of these countries, we invite you to contact us to learn more.
by logisticsplus | Mar 7, 2017 | News
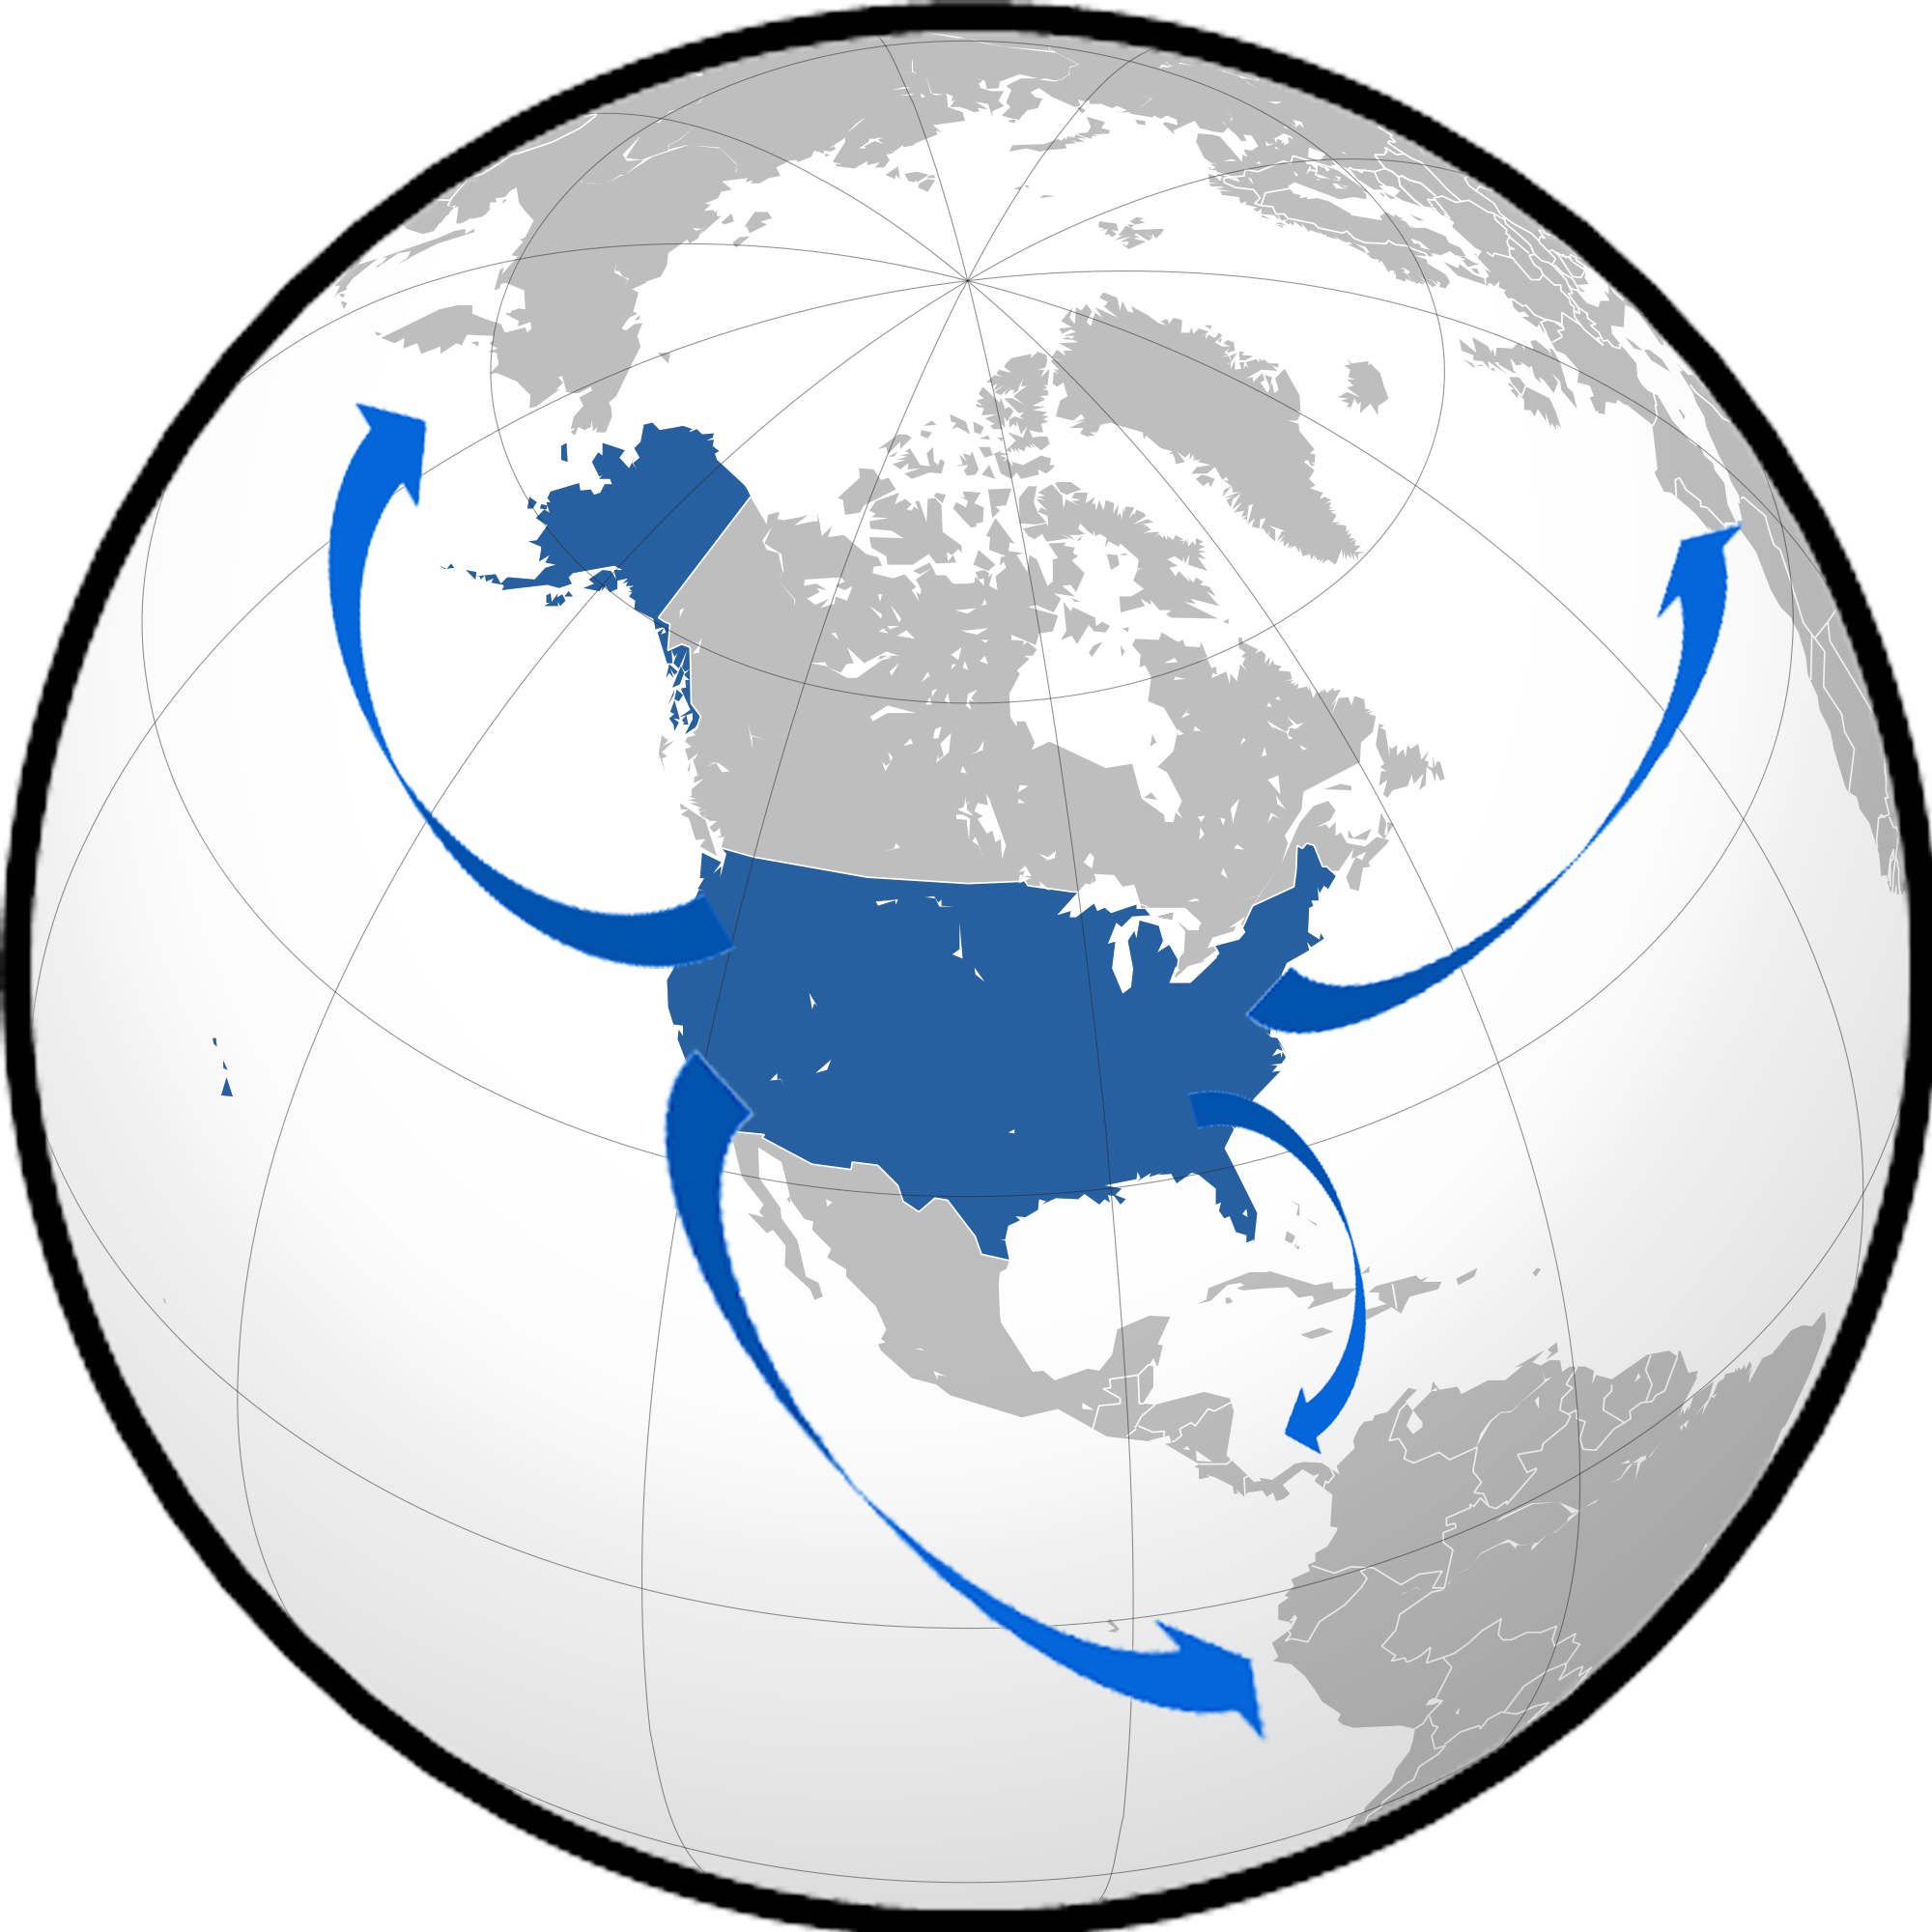
Overview. 2016 business reports show that U.S. exporters exported $2.2 trillion worth of goods and services. This was about 12% of total economic output in GDP terms. Keep in mind that only 1% of American businesses export their products. Based on the report, the U.S. is the 3rd largest exporter in the world right behind China and the EU, with Germany coming in at fourth place. This is a slight drop in total U.S. market share both in actual terms and as a percentage of global exports. Most of America’s exports are goods as well as service sector based products. The intangible nature of services makes them harder to export across countries and regions.
Top U.S. Exports
$1.46 of the $2.21 trillion exported items comprised of goods and items. This means two-thirds of what America exported were commodities. The products fall into seven categories. These are capital goods, industrial supplies & equipment, consumer goods, automobiles, agricultural products, and services.
- Capital Goods. A little over $500 billion worth of capital goods were exported mostly from 6 broad categories. These are Industrial machines ($51 billion), Commercial Aircraft ($121 billion), and Medical equipment ($35 billion). The others are telecommunications ($41 billion), semiconductors ($44 billion), and Electric apparatus ($42 billion).
- Industrial supplies and equipment. In 2016 the U.S. exported $398 billion worth of materials used. Most of these are oil and oil-based products. Chemicals topped the list followed by fuel oil, then petroleum products, and plastic. Non-monetary gold closed this list at $20 billion.
- Consumer goods. These constitutes 13% of the goods exported valued at about $200 billion. The breakdown is pharmaceuticals ($53 billion), cell phones ($24 billion) and gem diamonds ($21 billion). Consumer spending is influenced by disposable income, income per capita, living wage, household debt, consumer expectations and inflation rates
- Automobiles. These constitute 10% of the exported goods and services averaging about $150 billion. GM, Chrysler, and Ford are the largest cars manufacturers. There are a few smaller ones also in the market. The output has been growing significantly after taking a dip during the 2008 financial crisis.
- Agricultural products. At $131 billion this is one of the largest products exported from the U.S. markets. They tend to be generally cheaper since they receive lots of government subsidies. Bioengineering and chemical additives have helped to boost production and supply of agricultural products. Soybeans ($24B), Meat and poultry ($17B) and Corn ($11B) are the top three exported goods.
- Services. This constitutes one-third of U.S. export to global markets. It totals about $750 billion. Most of the exported services in the exported commodities and items. The largest service export is aircraft services ($293B), Computer & Related services ($178B), Intellectual property and royalties ($120B) and banking ($113B) as well as defense ($20B).
Challenges Facing the United States Exporting Sector
The United States export market has shrunk globally due to the emergence of developing industrial economies like Brazil, India, China, and Indonesia. These countries have developed industrial units that manufacture most of the goods for the local market which in turn lowers demand for American products.
- Secondly is standards of living. These countries have lower standards of living. This allows them to produce goods at a cheaper rate. The lower standards of living enable them to erode America’s competitive and comparative advantages across lots of industries. When it comes to automobiles Japanese, and European car makers producers better quality and cheaper cars that are well suited for global markets.
- Third, is the issue of oil. America is both a huge producer and importer of oil. That’s because they produce a lot yet their demand is even hired. Keep in mind that some of the oil that they produce does not meet their consumption standards, so they export it to Africa. Most of the oil produced is shale oil. America therefore still spends much more on buying oil abroad.
- American Trade Deficit. American trade deficit as of 2016 stood at $500 billion. We imported $2.7 trillion worth of goods and services while exporting $2.2 trillion. This is about $25 billion higher than 2013. This can mostly be attributed to the strengthening of the dollar by 25% between 2013 and 2016. Even then this deficit is $200 billion less than 2006 meaning, the value is on a general upward trend. The primary drivers of this deficit are consumer products (-$397B) and automobile (-200B) deficit.
- The deficit with Major Trading Partners. America’s top trading partners are China ($580B), Canada ($545), Mexico ($525B). The deficit with China stands at about $347B making them responsible for 70% of our deficit. This deficit significantly weakens the economy since the economy ends up being financed by debt which has to be paid back with interest. The dollar is said to have declined 40% between 2001 and 2007. This in turn weakness America’s competitiveness on the global stage.
Opportunities for U.S. Exporters
Despite the challenges, it’s not all gloom and doom. America has certain old and emerging opportunities on the export front. The U.S. exported $2.209 trillion worth of exports in 2016. America has a lot of potential given that this constitutes export from
1% of American firms only.
- The U.S. Dollar Is King. American competitiveness is still pegged on the good fortune of having the dollar as the world reserve currency. This minimizes the shocks that the economy might have to take in the short and medium term. The dollar still accounted for 62% of global bank reserves still ahead of the pond, Euro, Yen, and Yuan. This I good news for small time exporters in the market.
- African Renaissance. The growth and rise of African economies have created a middle class (est. 15% of pop) that has an increasing demand for American goods. Any small or medium-sized exporter who targets this market will greatly benefit. The purchasing power of African consumers haves been on a general upward trend over the past 15 years. Economies of Kenya, Nigeria, South Africa, Ethiopia, Egypt, and Congo continue to prove versatile in the face of internal challenges and shocks. They also have massive infrastructural spending that lifts the nation’s ease of doing business.
- Investors and Technology. The U.S. continues to lead as the most attractive market for investors especially from the developing Asian economies. That’s why the U.S. continues to get hundreds of billions in capital inflows. The Foreign Direct Investment inflows stood at $736B in 2016. That accounts for 15% of the global totals or $1 in every $6. Additionally, people still flock to the U.S. as tech innovators and inventors. It’s still the home to major social players and towers in spending levels.
Ready to start exporting? Have questions or need a reliable logistics partner? The export specialists at Logistics Plus are ready to help.

by logisticsplus | Jul 12, 2016 | News
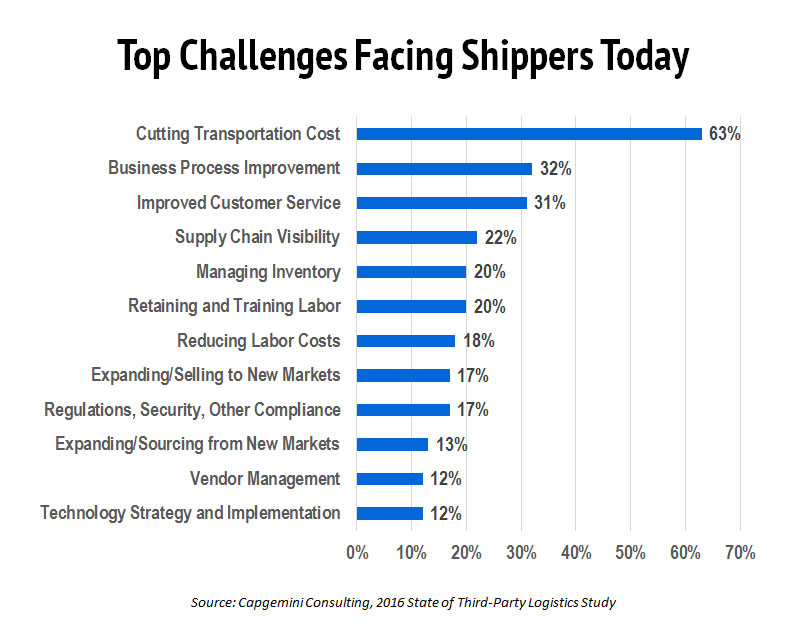
According to the 2016 State of Third-Party Logistics Study by Capgemini, the chart shown here presents some of the top logistics challenges facing shippers today. Not surprisingly, a majority of the study’s respondents indicated “cutting transportation cost” as a top challenge. Beyond that, many respondents identified less obvious pain-points, but important considerations nonetheless. As the study indicates, shippers are demanding greater innovation and technology advances while simultaneously remaining cost-conscious.
Outsourcing all or a portion of your transportation to a third-party logistics (3PL) company – like Logistics Plus – is one way shippers are addressing many of these challenges. 3PLs can often provide the required expertise, people, capacity, warehousing and IT systems needed to help shippers reduce transportation expenses, improve supply chain visibility, manage inventory more effectively, and achieve regulatory compliance.
If your business is facing any of these challenges, Logistics Plus can help.
Cutting Transportation Cost
With 20 years of expertise, and a $135 million client-portfolio, Logistics Plus is able to leverage its size, strength and experience to secure highly discounted rates for ground, air, ocean, and rail transportation services. Since we are viewed as a reliable, large-sized shipper ourselves, the rates we secure are often better than what small or medium shippers would be able to secure on their own; and with a letter of authorization, we can even help large shippers negotiate the best rates on their behalf.
Business Process Improvement
With our 4PL or managed transportation solutions, we work as an extension of your team to identify the weakest links in your supply chain, and then we help you repair them. From planning and strategy to services and options – we’ll help you streamline your supply chain so that you can focus on what you do best – manufacture and sell great products.
Improved Customer Service and Supply Chain Visibility
Our technology solutions, like eShipPlus and eWorldPlus, provide visibility to your products both domestically and internationally. Greater visibility leads to a more predicable experience and improved customer service. Our caring professionals will also ‘go-to-bat’ for you when problems occur to ensure the best possible outcomes for you and your customers.
Managing Inventory
We manage and operate dozens of warehousing facilities around the world. In the United States, we have West Coast, Southwest, Midwest and Northeast facilities with the capacity and expertise to manage both industrial and retail inventories (including Fulfillment By Amazon). Our WMS technology provides complete visibility throughout the entire process. You only source the space you need, the time you need it, and where you need it – nothing more.
Retaining and Training Labor and Reducing Labor Costs
As an extension to your team, we provide the skilled and trained logistics specialists you need – and we scale them according to your demand. That keeps your labor costs low and your headcount variable for when you need it most.
Expanding/Selling to New Markets and Expanding/Sourcing from New Markets
With 400+ employees working in 20 different countries around the world (and additional agents in virtually every country), we have the local knowledge and expertise you need to import, export, and transact globally. On the sourcing side, we can help you with services such as purchasing, expediting and inventory management. We can identify the product, negotiate the price, purchase it, ship it and deliver it to your door: truly one-stop shopping!
Regulations, Security, Other Compliance
Our full-service compliance department can quickly identify your needs, contain costs, and minimize your risk. Our customs specialists help you comply with existing government regulations and stay ahead of changing customs compliance laws to reduce your risk, eliminate errors, and lower your costs.
Vendor Management
Reducing inbound shipping costs is one of the easiest, yet most overlooked ways to reduce your overall transportation spend. Vendors applying a “prepaid-and-add” approach to your purchase orders may be costing you more money than you realize for inbound transportation. Logistics Plus can help you take control of your inbound orders by creating updated routing requests and shipping instructions, monitoring carrier compliance, and then consolidating and auditing all of your freight invoices.
Technology Strategy and Implementation
Our transportation and cargo management platforms are easy-to-use and can be fully integrated with your back office systems. EDI, API, or web services – our technology professionals will be able to recommend the right strategy and implementation plan for your situation.
So what’s YOUR logistics challenge? We want to know. Just click the button below and tell us your most pressing transportation or logistics challenge. Our talented and caring professionals will work with you to provide a customized solution that addresses the logistics challenges that YOU are facing today.

by logisticsplus | Jul 24, 2015 | News
The United States International Trade Commission just released its updated “The Year in Trade 2014” report. The report, which covers global trade trends and activities, indicated that the value of U.S.-India two-way merchandise trade has increased 5% since 2013. In 2014, merchandise exports to India were valued at $21.6 billion. Leading U.S. exports to India included diamonds, aircraft and parts, gold, and coal. 2014 imports from India were valued at $45.2 billion, with non-industrial diamonds, certain medicaments, petroleum-related products, food, apparel, chemicals, and steel products all leading the way. The report went on to say that the U.S. and India continue an ongoing dialogue to improve trade relations going forward.
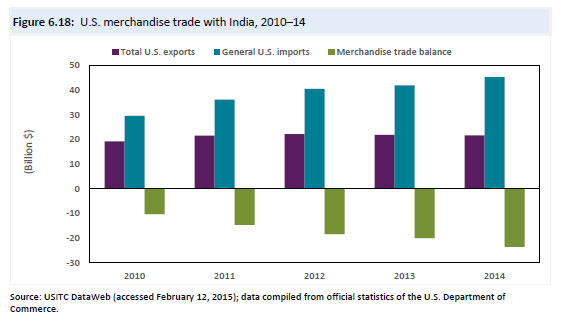
While these numbers may seem impressive (India is the 11th largest foreign trading partner with the U.S.), some economists forecast that these numbers could double in the next five years. Contributing to this growing trend is the fact that India is the world’s largest democracy and the second-most populous country in the world. The country has a burgeoning urban middle class and has made great strides in fields such as information technology. Its large, skilled workforce makes it a popular choice for international companies seeking to outsource work.
If your company imports or exports merchandise from India, you should consider working with Logistics Plus. In the U.S. we have more than a dozen locations around the country that can help you with your transportation and logistics needs, and our Customs Broker Solutions staff can also help you clear customs for imports at any port in the United States. Additionally, we have six offices in India located in the cities of New Delhi, Bangalore, Chennai, Jalandhar, and Mumbai.
If you’re located in the U.S. and interested in learning more, please contact us or use our international quick quote form if you have an upcoming shipment. You can also call 1.866.564.7587 or email quotes@logisticsplus.com with any questions. If you’re located in India, you can complete our India logistics solutions request form or use our international quick quote form if you have a shipment. You can also call our New Delhi main office at +91.124.474.9200 or email sundreysh.sarup@logisticsplus.com with specific questions.
As always, you can find any of our worldwide employees in our online global directory.